






Thermal conductivity measurement can seem straightforward: prepare a sample, apply heat, and record how quickly energy moves. In practice, small details can shift the result. A smudged surface, uneven contact pressure, or a drifting temperature sensor may create errors that are difficult to spot in the final reading. Even a well-designed instrument cannot correct every problem in sample preparation.
Reliable results depend on matching the method to the material and measuring conditions. A steady-state technique may suit a thick, uniform specimen, while thin films or changing temperatures can require another approach. Calibration, sample dimensions, heat loss, and contact resistance all deserve attention. Keep the specimen clean and flat. Check sensor placement. Record ambient temperature and instrument settings, too. These steps sound basic, but they are often rushed.
This guide presents seven practical tips for improving thermal conductivity measurement, from preparing specimens to reviewing uncertainty. The aim is not to promise perfect values. No measurement is free from assumptions, and a result can look more precise than the setup deserves. Compare repeat tests, document unusual observations, and question unexpected readings before reporting them. When possible, follow the instrument manufacturer’s procedure and a suitable recognized test method. Careful records make results easier to interpret, reproduce, and discuss with others.
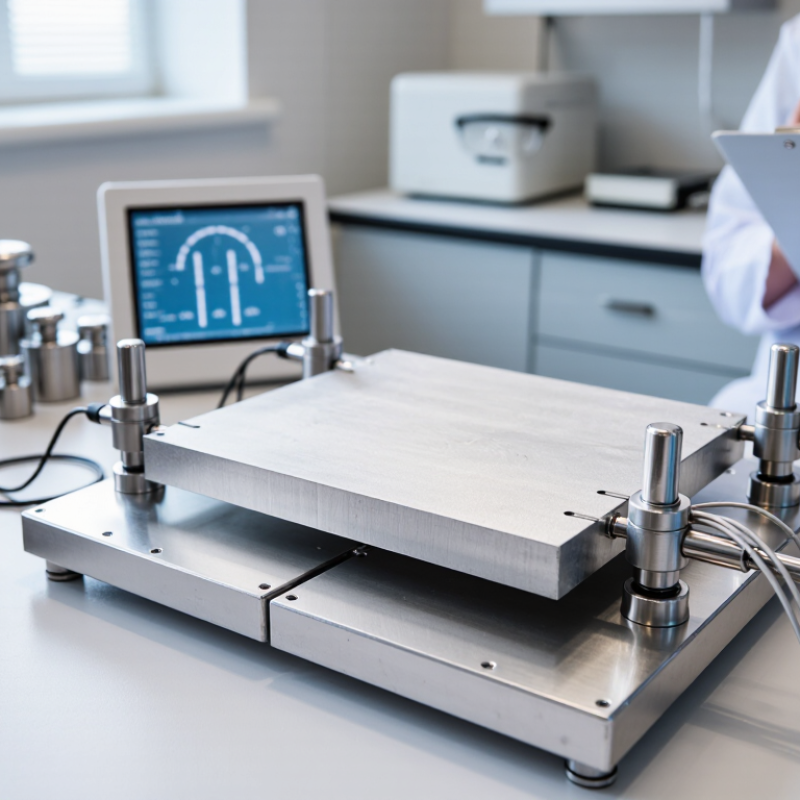
A reliable thermal conductivity result starts with a clearly defined test condition. Record the sample’s composition, thickness, density, and physical state; even small differences in porosity can change heat flow. Set the test temperature and allow the specimen to reach it evenly. A warm surface and a cooler core can distort the reading. Moisture matters, too, so note whether the material is dry, conditioned, or tested as received. Keep the measurement direction consistent, especially with layered or fiber-based samples.
Choose a method that fits the sample size and expected conductivity, then document its settings. For contact measurements, specify the applied pressure and inspect the surfaces for gaps or rough spots. For transient tests, record probe placement, heating duration, and the time allowed between runs. Use calibration checks and repeat measurements under the same conditions. Small differences are worth investigating. One overlooked detail is often the room itself: drafts, nearby heaters, or a cold workbench can affect a sensitive setup. Even a careful protocol has limits. Record deviations rather than quietly correcting them, and report uncertainty alongside the final value.
Thermal conductivity measurements are only meaningful when the method fits the specimen. A guarded hot plate suits flat, uniform materials when steady-state testing is practical. It can be a poor fit for tiny or irregular samples. Transient methods can test smaller pieces quickly, but probe contact and sample preparation matter. Laser flash methods are often used for thin, solid specimens, where diffusivity is measured and conductivity is calculated using density and heat capacity.
Match the technique to the material’s structure and expected temperature range. For layered or anisotropic samples, test along the direction that matters; a single reading may hide strong directional differences. Porous, soft, or moisture-sensitive materials need careful handling because compression, drying, or air gaps can shift results. Keep sample dimensions, surface condition, and temperature consistent across repeats. The setup may look simple. Small details are not.
Tips: Check whether the method measures conductivity directly or derives it from other properties. Use a reference material to verify the setup, and repeat measurements on separate spots. Record contact pressure and conditioning time. If results disagree, revisit the assumptions before averaging them. One “best” method rarely exists.
Reliable thermal conductivity measurements begin with a sample that matches the test method’s geometry. Cut it evenly, and measure its thickness at several points with a calibrated micrometer. A slight taper can distort the result. Keep the faces flat, clean, and free of loose particles. For porous or moisture-sensitive materials, record conditioning time and temperature; water content can change heat flow. Small gaps matter. I have found that handling marks or a rough edge are easy to overlook, so inspect the specimen under good light before loading it.
Check instrument calibration with a certified reference material whose conductivity range is close to the sample’s. Follow the instrument procedure, and record the reference value, test temperature, and date. Let the system reach thermal stability before measuring. Watch for drifting readings, uneven contact pressure, or changes in room temperature. Do not rush. If the reference result falls outside the stated tolerance, pause and investigate the setup rather than applying a correction blindly. Repeat the check after maintenance or a major change in test conditions. Keep notes, even when a run looks routine; small setup differences can explain results that otherwise seem inconsistent.
Accurate thermal conductivity measurement depends on more than the instrument. The sample and sensor must reach a stable temperature before readings begin. Even a small temperature drift can change the result, especially when testing materials with low conductivity. Wait for the display to settle, and record the sample’s temperature alongside each measurement. Small changes matter.
Tip: Keep contact consistent. Clean both surfaces, remove loose dust, and apply the same sensor pressure each time. A tiny air gap can act as insulation and make conductivity appear lower than it is. Avoid pressing harder just to improve contact; pressure may deform soft samples. Note any uneven or rough areas, because perfect contact is not always possible.
Control the surroundings, too. Keep the test away from direct sunlight, open windows, fans, and nearby heat sources. Air moves heat. Let the sample adjust to the room before testing, and avoid handling the measurement area with warm fingers. If humidity or airflow cannot be held constant, record those conditions; they may help explain results that do not repeat. A careful setup reduces uncertainty, but it does not erase it. Sometimes the reading still varies, and that is a reason to check the setup again.
Control temperature, contact, and environmental effects. These representative values near room temperature show the wide range of thermal conductivity across common materials; actual values vary with composition and temperature.
For reliable measurements, stabilize and record the sample temperature, ensure consistent probe contact and pressure, and limit heat loss from drafts or surrounding surfaces. Use suitable reference materials and report the method and uncertainty.
Repeat measurements on the same specimen, then repeat the test after remounting it. These checks reveal different problems. A steady reading can still hide poor contact between the specimen and sensor. Watch for shifting clamps, trapped air, and temperature drift across the sample. Small differences matter. Record every reading, not just the one that looks best. For each set, calculate the mean and standard deviation; also note the specimen, mounting pressure, and room conditions. I have found that tidy records expose inconsistent handling, though they cannot fix it.
Separate random variation from systematic effects, such as calibration, sensor placement, or heat loss. NIST Technical Note 1297 explains how to combine uncertainty components and report expanded uncertainty. It uses a coverage factor of 2 for roughly 95% coverage when the uncertainty distribution is approximately normal. That figure is not a promise. If readings are skewed or the setup changes between tests, the estimate may mislead.
ASTM E1225 describes a comparative method for thermal conductivity measurement; its controlled heat-flow arrangement makes contact and temperature gradients especially important to document. Include instrument resolution and calibration information in the uncertainty budget. Then compare repeatability with the larger uncertainty sources. The uncomfortable part: more repeats reduce random noise, but they do not erase a biased setup.