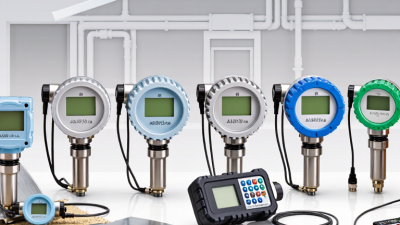







Choosing the best omega heat flux sensor for 2026 depends less on a universal ranking and more on the measurement job. A sensor used on a warm metal plate may not suit a curved surface, a changing airflow, or a test with limited mounting space. Small details matter. Heat flux range, sensitivity, operating temperature, response time, and sensor dimensions all affect whether readings are useful.
This guide compares the factors that help engineers and researchers narrow their options. It considers published specifications, installation requirements, signal conditioning, and the conditions surrounding the measurement. A thin sensor can reduce disturbance to a surface, while cable routing and attachment methods may still influence the result. The details deserve checking.
A good selection process also asks how measurements will be verified. Calibration information, repeatability, and clear documentation support more reliable decisions than a product name alone. Even then, no specification sheet can answer every practical question; surface contact and test setup can introduce uncertainty. That is easy to underestimate. The recommendations in this overview are intended as a starting point, not a substitute for reviewing current manufacturer data or validating a sensor in the actual application. By matching the omega heat flux sensor to its environment and measurement goals, readers can make a more informed comparison for 2026.
Heat flux, q, is the rate of heat crossing a surface per unit area, expressed in watts per square metre (W/m²). It is not a temperature reading. A thermopile sensor converts that heat flow into a small voltage, commonly measured in microvolts (μV). Its calibration sensitivity links the two:
where V is sensor output and S is sensitivity. NIST Special Publication 811 gives the relevant unit conversion:
Small units matter here. Confusing voltage with heat flux can produce convincing, but incorrect, results.
For a simple illustration, a sensor with a sensitivity of 10 μV per W/m² would produce 250 μV at 25 W/m². This is a calculated example, not a typical sensor specification. ASTM C1130 describes calibration practices for thin heat-flux transducers; check the calibration certificate and stated uncertainty before comparing models.
In use, mounting pressure, surface contact, and temperature gradients can all affect the reading. A tidy number can still be wrong.
For a 2026 selection, match the sensor’s range and sensitivity to the expected flux, then verify that the readout can resolve its microvolt output without excessive noise.
One weakness remains: even careful calibration cannot fix poor installation.
Choosing a heat-flux sensor starts with the expected signal, not the highest sensitivity on a catalog page. For building-envelope tests, an illustrative wall with U = 0.25 W/m²·K and a 20 K temperature difference produces about 5 W/m². A sensor must resolve that modest flux above its noise floor. ISO 9869-1:2014 describes in-situ heat-flow-meter measurements and a minimum 72-hour measurement period, underscoring why stable, low-level readings matter. For ovens or process lines, select a rated flux comfortably above the expected peak; overload can damage the sensor or distort readings. Range matters more.
Sensitivity and rated flux are a trade-off. A high-output sensor can make small changes easier to detect, but it may saturate sooner. A wide-range unit tolerates stronger loads, yet its signal may be harder to distinguish from electrical noise at low flux. Check the stated calibration range, temperature limit, response time, and mounting method. A thick adhesive layer or uneven contact can add thermal resistance and skew a real measurement. This detail is easy to miss.
Tips: Estimate minimum and peak flux before choosing. Leave headroom above the peak, then confirm the sensor’s sensitivity produces a readable signal at the minimum. Record surface temperature and installation details. I would also repeat a short test; mounting errors are stubborn, and a neat-looking trace is not proof of accuracy.
Choosing a heat flux sensor means matching its temperature range to the real surface, not just the expected average. Check continuous and peak limits, then leave margin for startup spikes and uneven heating. A sensor rated near its limit may drift or fail sooner. Small details matter. Response time also depends on sensor thickness, contact quality, and the logger’s sampling interval; a fast sensor cannot fix slow data collection. ASTM C1130, the practice for calibrating thin heat-flux transducers, is a useful reference when comparing calibration methods and measurement uncertainty.
Mounting can change the reading. Clean the surface, keep the sensing face flat, and use a thin, even interface layer; thick adhesive can add thermal resistance. Secure leads so they do not tug the sensor, especially on curved or vibrating equipment. ISO 9869-1:2014 specifies at least 72 hours of monitoring for its in-situ heat-flow-meter method. That is a field-measurement benchmark, not a sensor response-time rating.
Contact is everything. In practice, installers may still struggle to get repeatable contact on rough surfaces, so document the attachment method and verify readings against a known condition before trusting a long run.
Choosing a heat flux sensor starts with its measurement range, but calibration evidence matters just as much. ASTM C1130 describes a practice for calibrating thin heat-flux transducers; it does not certify every sensor or installation. Check that the calibration report identifies the sensor, calibration conditions, reference method, and uncertainty. The tested range should cover your expected heat flux, not merely one convenient point. Small details matter. Mounting pressure, surface contact, orientation, and temperature can all affect readings. A neat certificate can still miss a messy installation.
Check the units before comparing specifications. A heat flux of 1 W/cm² equals 10 kW/m², since one square centimetre is one ten-thousandth of a square metre. For example, a reading of 0.2 W/cm² corresponds to 2 kW/m². Confirm whether the stated range and calibration data use the same units. Also ask whether calibration covers the direction of heat flow in your setup. Not always. A sensor calibrated under different contact or temperature conditions may behave differently in the field. Record those conditions during use, and treat calibration uncertainty as part of the measurement, not fine print.
Choosing a heat flux sensor for 2026 starts with the expected measurement range. A sensor rated too low may saturate during a short heat pulse. One with excessive range can make small changes harder to resolve. Estimate the lowest and highest flux at the actual mounting surface, not just in the test chamber. Leave room for spikes. Real setups can be messier than calculations suggest.
Accuracy is not a single number. Check the stated uncertainty, calibration conditions, operating temperature, and sensor response time. A fast-changing process may need a quicker response, while steady insulation tests may benefit more from stable readings. Also review the full measurement chain: cable length, amplifier input, connector type, and data logger settings can all affect results. A well-matched sensor cannot fix a poorly configured readout.
Before selecting a model, confirm that its output works with your meter or data-acquisition system, and check whether external signal conditioning is required. Compare usable range and accuracy under your own test conditions, rather than choosing by headline specifications alone. I would verify the calibration interval, too; it is easy to overlook when comparing datasheets. There is no perfect pick. Keep the sensor’s mounting method in the decision, since uneven contact or a thick adhesive layer can distort readings.
Compare reference heat-flux levels in two common units. The bars show unit conversions—not ratings for any particular sensor.
How to choose: Select a sensor whose calibrated range covers the expected peak heat flux. Compare accuracy at your operating conditions using the sensor’s stated calibration uncertainty; range alone does not determine accuracy. For readout compatibility, check the sensor’s output and sensitivity against the meter’s input range, resolution, and input impedance.