







What is the best solar power monitor in 2026? The right choice depends on what you need to see. Some homeowners want a clear view of daily generation. Others need to compare solar production with household use, battery storage, or grid imports. A useful monitor turns those numbers into practical decisions. Not just colorful charts.
This guide compares solar power monitor options by compatibility, measurement detail, app quality, and installation needs. We look for clear readings, dependable data, and explanations that make sense outside an engineering manual. A monitor may use inverter data, current sensors, or both. Those methods can show different parts of your energy picture, so matching the device to your system matters. Check your inverter model, phase configuration, and battery setup before buying. Small details count.
Accuracy deserves attention. So does ease of use. A dashboard that updates slowly may still suit basic monthly checks, but it can frustrate anyone tracking changes throughout the day. We also consider setup effort, ongoing costs, and how clearly the manufacturer explains its limits. No device is perfect, and product specifications do not always reflect real homes, with their shaded panels, changing loads, and occasional Wi-Fi dropouts. That deserves a second look. The recommendations ahead aim to help you choose with realistic expectations, not promise identical results for every installation.
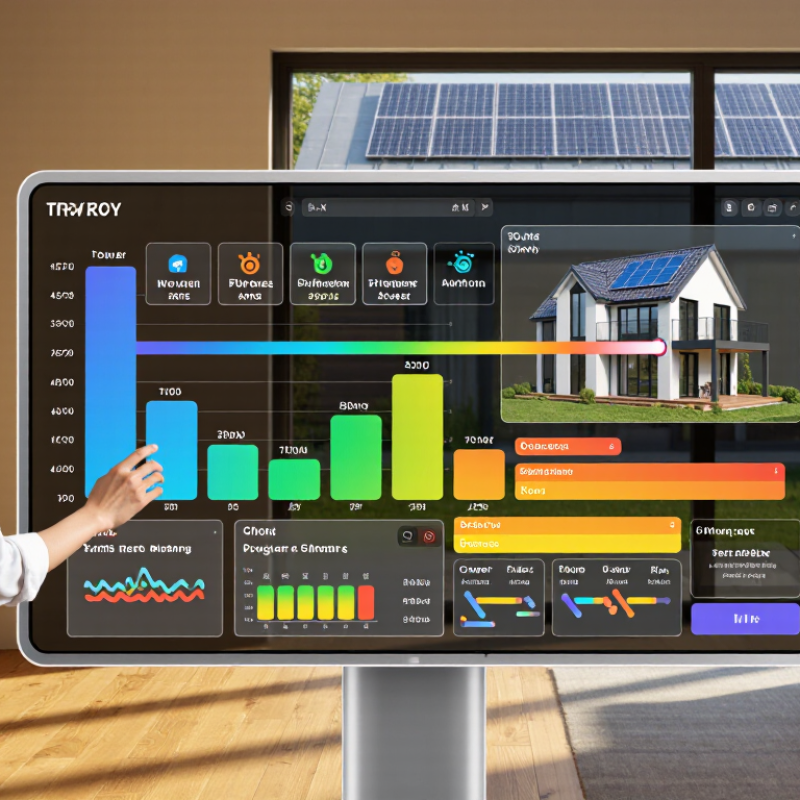
Choosing the best solar power monitor in 2026 starts with understanding what solar monitoring does. It tracks electricity production, household use, grid exports, and system alerts. The IEA reports that 346 GW of solar PV capacity was added worldwide in 2023. That scale matters. More panels mean more generation data to interpret, not just a larger number on a screen.
A useful monitor shows production in clear time intervals and compares it with household demand. Check whether readings update reliably and whether the system flags drops in output. For example, a sudden dip on a bright afternoon may point to shading, a tripped circuit, or a reporting issue. A monitor cannot diagnose every fault. Some data can also be delayed or incomplete, so compare readings with your electricity meter when something seems unusual.
Tips: Review daily patterns for a week before drawing conclusions. Note cloudy weather and high-use appliances, such as an oven or dryer. Look for simple charts, clear alerts, and access to historical data. The best choice is the one that helps you understand your own system. No dashboard is perfect; I would treat its estimates as useful evidence, not unquestionable truth.
What Is the Best Solar Power Monitor in 2026?
Compare Monitor Types Against IEC 61724-1 Monitoring Classes
The best solar power monitor depends on the decisions you need it to support. IEC 61724-1 groups monitoring systems into Classes A, B, and C, from more comprehensive measurement to basic monitoring. Class A suits sites needing detailed performance analysis, with carefully specified irradiance and temperature measurements. Class B offers a middle ground for operational oversight. Class C can fit smaller systems where basic energy tracking is enough. That difference matters. A dashboard showing daily kilowatt-hours may flag an outage, but it cannot always explain whether low output came from clouds, heat, or a system fault.
A 2013 NREL-led review of roughly 2,000 photovoltaic degradation rates found a median decline of about 0.5% per year. That slow change is hard to spot without consistent records. A Class A setup can help investigate subtle performance losses; a simpler monitor may be adequate when only production totals matter. Small systems vary. The class label alone does not guarantee useful data: sensor placement, calibration, and missing readings still matter. Check those details before comparing monitor types, and match the measurement accuracy and reporting intervals to your site. Even a polished graph can hide a poorly placed sensor. It is worth asking whether the extra measurements will change maintenance decisions.
A useful solar power monitor should show more than today’s total. It should record daily and monthly energy yield, display historical data, and make changes easy to spot. Compare output across similar seasons, not just consecutive weeks. Cloud cover, heat, snow, and shade can all affect production. A sudden dip deserves attention, but one cloudy afternoon is not evidence of a fault. Small patterns matter.
NREL’s 0.5% annual PV degradation benchmark offers a reference for gradual performance loss, not a promise for every system. Panel age, climate, installation, and measurement methods can shift results. To estimate your system’s trend, compare normalized production over several years and account for sunlight levels and downtime. Check whether the monitor measures inverter output or household consumption; those figures answer different questions. A neat chart can still mislead.
Tips: Save monthly yield readings and note cleaning, repairs, or new shade, such as a growing tree branch. Use the same comparison period each year. Investigate persistent gaps against expected output, but avoid treating a single reading as a diagnosis. Monitoring is useful, imperfect work.
A useful solar power monitor in 2026 should show three flows: panel production, household use, and grid import or export. Accuracy depends on more than a tidy screen. Sensor placement, wiring direction, and update intervals can all affect readings. Compare its numbers with inverter records and a utility meter over several clear and cloudy days. Small errors matter.
Compatibility deserves equal attention. Check whether the monitor supports your system’s phase, inverter communication method, and battery setup before buying. Some homes have split circuits or older panels, so a simple installation diagram may not tell the whole story. Ask what readings remain available if internet service drops. That detail is easy to miss.
Useful alerts should be adjustable, not noisy. A sudden production drop, unusual overnight draw, or lost connection can prompt a practical check. Data access matters too: look for clear history, downloadable files, and stated retention limits. Local storage can help during outages, while cloud dashboards may offer easier remote viewing. Neither is perfect. Honestly, a few missing readings may still occur; judge how clearly the system marks gaps instead of filling them with false precision.
A practical comparison framework for evaluating monitoring options by accuracy, compatibility, alerts, and data access.
Scores are editorial priorities on a 1–5 scale, not measured ratings of specific products. Check each monitor’s published specifications and test compatibility with your inverter, meter, and electrical system before buying.
Choosing a solar power monitor starts with the system you need to understand. A small rooftop array may only need clear daily production and household-use readings. Larger systems benefit from circuit-level measurements that show where power goes during busy evening hours. Check that the monitor supports your inverter and electrical setup before comparing features. Compatibility is not a small detail.
Batteries add another requirement. Look for reliable readings of charging, discharging, and state of charge, not just solar generation. Some systems update data with a short delay, so they may not suit people troubleshooting rapid changes. That matters. If readings seem inconsistent, compare them with the inverter’s display over several days; one odd afternoon can mislead.
Budget should include installation, not only the monitor itself. Basic devices may be adequate for tracking totals, while extra sensors can reveal which circuits use the most energy. Keep it simple. If installation involves opening an electrical panel, have a qualified professional assess and fit the equipment. Ask about data storage, app fees, and whether readings remain available during an internet outage. No monitor is perfect: detailed data can be useful, but it can also create noise if you rarely act on it.