






Choosing the best solar power monitor for 2026 depends on what you need to see, not just how polished its app looks. A useful monitor can show solar production, household consumption, and electricity moving to or from the grid. Some systems also track battery charging and discharging. That detail matters when rooftop panels produce more power than your home uses at noon, then less after sunset.
Numbers can mislead. Readings may differ between a monitor, inverter, and utility meter because they measure energy at different points. Compatibility matters, too: some devices use clamp sensors around electrical wires, while others rely on inverter data or smart-meter connections. Before buying, check your panel or inverter model, installation requirements, display options, and any ongoing app fees. If wiring or electrical access is involved, ask a qualified installer what is appropriate for your home.
This guide compares the features that make a monitor genuinely useful: measurement detail, update speed, data history, alerts, and ease of setup. It also considers privacy, reliability, and whether the system remains informative during an internet outage. A sleek dashboard is not enough. You should be able to answer practical questions, such as whether the dishwasher is using midday solar power or drawing from the grid. The ideal choice is not automatically the most expensive or feature-packed. It is the one whose readings you understand and can verify. Even then, no monitor tells the whole story; tariff rules and household habits can change what the numbers mean.
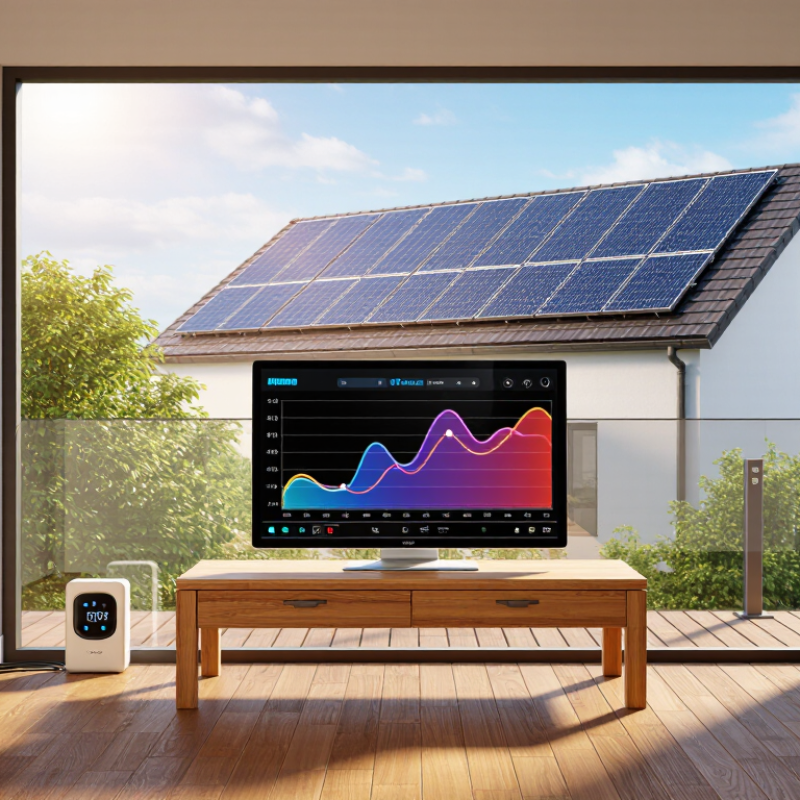
A solar power monitor turns rooftop activity into measurable signals. It typically reports instantaneous power in watts and energy produced over time in kilowatt-hours. Depending on its sensors, it can also show household use, grid imports and exports, battery charge, and inverter alerts. Small details matter. A sunny afternoon should produce a clear rise in output; a sudden dip may point to shade, a tripped circuit, or a device fault. The monitor flags a change, but it cannot always identify the cause.
The scale is substantial. IEA PVPS estimated that 456 GW of solar capacity was added worldwide in 2023. In the United States, SEIA and Wood Mackenzie reported 32.4 GW of new solar installations that year. Those figures describe industry growth, not the output any one home should expect. NREL’s photovoltaic operations and maintenance guidance emphasizes tracking performance and availability over time. Comparing daily production with past readings and local weather can help reveal persistent underperformance. Still, readings can be confusing. A low number at noon may reflect clouds, not a failing system, and household-use data depends on correct sensor placement. One imperfect reading is not a diagnosis.
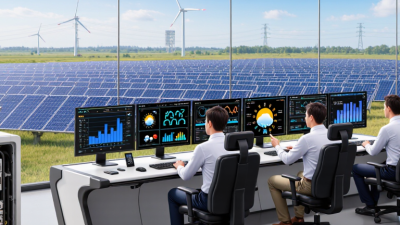
A solar monitor turns scattered electrical readings into a usable picture of system performance. Inverters report power, voltage, current, and operating status. A revenue-grade meter can show energy moving to or from the grid. Some systems add irradiance and module-temperature sensors, which help explain why output changed. A site gateway timestamps the readings and sends them to a local display or online dashboard. Details vary. Sensor placement and sampling intervals can affect the result.
The IEA PVPS Snapshot of Global PV Markets 2024 reported at least 407 GW of solar capacity added worldwide in 2023, bringing total capacity beyond 1.6 TW. That growth makes dependable data increasingly useful for spotting underperformance across large fleets. Monitoring guidance from the U.S. National Renewable Energy Laboratory also emphasizes consistent data collection and clear fault alerts. A good system compares measured output with expected production, then flags gaps, inverter trips, or unusual drops. It should show the raw values behind an alert, not just a red warning icon. That distinction matters. A dashboard can look reassuring while a poorly placed sensor skews the story. Cloud cover, shading, and normal inverter clipping can resemble faults, so automated alerts still need careful interpretation.
What Is the Best Solar Power Monitor for 2026?
Key Features for Comparing Solar Monitors in 2026
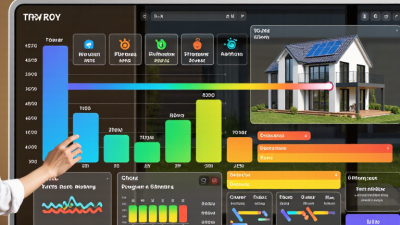
A useful solar monitor should show more than total energy produced. Look for clear, timely readings of solar generation, household use, and grid imports or exports. A simple dashboard can help explain why a sunny afternoon still comes with a high bill. Small details matter. Check whether readings update often enough for your daily decisions, and whether the display works well on a phone or a dedicated screen. Also compare installation requirements: some systems need compatible meters or professional setup.
Tips: Before choosing, note your inverter type, electrical setup, and the data you actually want to see. Ask whether the monitor tracks energy by circuit or only across the whole home. Check the gap. A device that omits battery charging or export data may give an incomplete picture, even if its charts look polished.
Reliable comparisons should cover measurement accuracy, historical data, alerts, privacy settings, and ongoing costs. Check how the monitor handles weak Wi-Fi and whether stored readings return after an outage. Clear explanations matter too; unexplained spikes can lead to the wrong conclusion. No monitor removes every uncertainty. Even good readings need context, and I would be cautious about treating one unusual day as proof of a system fault.
Key Features for Comparing Solar Monitors in 2026
This illustrative sunny-day profile shows hourly energy in kilowatt-hours for a typical home solar system; it is not measured product data. When comparing monitors, check that they clearly report solar generation and home consumption, and look for useful details such as update interval, measurement accuracy, grid import and export, and historical data access.
Choosing a solar monitor starts with your installation, not its dashboard. A rooftop system with microinverters may provide panel-level readings, while a string-inverter system often reports production centrally. For household import and export data, check whether the monitor supports compatible current sensors and where they must be installed. Add a battery, and confirm that the system can distinguish charging, discharging, and grid exchange. Small compatibility gaps can distort the picture.
Scale matters. IRENA’s Renewable Capacity Statistics 2024 reports 346 GW of new solar capacity added worldwide in 2023, but a global figure cannot tell you which monitor fits your home. Ask your installer about inverter communications, sensor placement, data refresh rates, and internet outages. A daily graph may be enough for a simple system; frequent readings help when you are tracking loads or battery behavior. Look for clear alerts and downloadable history, too. Does the monitor measure household use directly, or estimate it? That difference can explain why evening consumption looks oddly low. I would not trust a polished screen without checking its readings against the inverter and utility meter.
| Monitoring Approach | What It Measures | Best Match | Data and Visibility | Key Requirements | Main Limitations |
|---|---|---|---|---|---|
| Inverter-integrated monitoring | Solar production reported by the inverter; some systems also show inverter status and fault alerts. | Grid-connected installations where production tracking and basic system-health checks are the main goals. | Often available through a web portal or app. Update frequency and historical data depend on the inverter and its communications connection. | A compatible inverter and, for remote access, a working internet or cellular connection. | May show solar generation without showing household consumption, grid imports, or exports. Monitoring detail varies by system. |
| Whole-home consumption monitor with current transformers (CTs) | Electrical current measured on selected conductors; with suitable voltage references and configuration, a system can estimate household power use and energy flow. | Homeowners who want to compare solar production with whole-home consumption and identify usage patterns. | Can provide frequent readings and usage history, depending on the monitor, installation, and communications setup. | Correctly sized and positioned CTs, compatible electrical equipment, and careful configuration. Installation inside electrical panels may require a qualified electrician. | Measurement accuracy depends on sensor placement, configuration, and supported electrical supply. A consumption monitor alone may not provide certified billing data. |
| Bidirectional utility or revenue-grade meter | Energy imported from the grid and exported to it; a bidirectional meter records flow in both directions. | Installations where grid import and export totals, utility records, or settlement data are important. | Provides cumulative energy readings. Near-real-time access depends on the meter, utility, and any connected communications service. | A meter configured for the applicable service and utility requirements. Billing or compensation rules vary by location. | May not show appliance-level use or detailed solar-system performance. Utility access to interval data may be limited or delayed. |
| Module-level monitoring | Output or operating status for individual solar modules or module groups, when supported by the system architecture. | Rooftops with partial shading, multiple orientations, or a need to locate performance differences between modules. | Can make module-level production differences easier to spot; resolution and update frequency depend on the electronics and monitoring service. | Module-level power electronics or other compatible equipment, plus a monitoring gateway or communications link where required. | Usually adds system complexity and cost compared with basic inverter monitoring. Module-level readings do not, by themselves, confirm the cause of a performance issue. |
| Battery and energy-management monitoring | Supported measurements can include battery state of charge, charge and discharge power, solar production, household load, and grid flow. | Hybrid or off-grid systems, and grid-connected homes that use a battery for backup or energy shifting. | Can show how energy moves between solar panels, battery, home, and grid when all relevant devices are integrated. | A compatible battery, inverter, and energy-management system. Backup and grid-control functions must be configured for the local installation. | Measurements and control features vary by system. A displayed battery percentage is an estimate, not a direct measure of remaining usable energy. |
| Selection tip | For production only, start with inverter-integrated monitoring. To understand household use, look for consumption monitoring. To track grid imports and exports, confirm that the setup measures both directions. Choose module-level or battery monitoring only when those details match the installation and the monitoring hardware supports them. | ||||
What Is the Best Solar Power Monitor for 2026?
Which Solar Power Monitor Offers the Best Fit in 2026?
The best fit depends on what you need to see: solar production, household use, grid imports, or battery activity. Check that the monitor works with your inverter and electrical panel before comparing apps. EIA’s 2020 Residential Energy Consumption Survey reported average household electricity use of about 10,566 kWh annually. That is a useful reference, not a personal target; climate, home size, and heating systems change the picture. Small screens matter. A clear daily graph can reveal a production dip that a monthly total hides.
Look for near-real-time readings, exportable data, and alerts for unusual drops. If you have a battery, confirm that the monitor separates charging, discharging, and grid exchange. NREL’s PVWatts model also shows why local context matters: expected solar output depends on location, system size, tilt, and orientation. Compare measured output with a weather-aware estimate, rather than treating every cloudy afternoon as a fault. One caveat: app estimates can differ from utility bills because their measurement points and time periods may not match.
Tips: Check your panel’s available space and wiring requirements first. Ask how often readings update, what happens during an internet outage, and whether historical data can be downloaded. If you rent, or cannot access the main panel, a simpler inverter-based view may be the practical choice. A perfect dashboard still cannot explain every dip; a nearby tree may be the cause.